≡ Menu

dougmcclure.net

thoughts on business, service and technology operations and management in the digital transformation era

I’ve been working on our big demo for the upcoming IOD Big Data and Analytics conference in November where we’ll highlight our Smart Cloud Analytics portfolio and ran into what’s likely a common challenge in many client environments.

We include the right to use the IBM Tivoli Log File Agent (LFA) and I was happily going down the path to install the LFA on some remote systems. All was fine until I came to a system that the LFA installer complained about not having enough disk space. I started the normal tasks of looking for big files, tarballs, etc. to whack and was able to do that some, but whatever was installed wasn’t budging and / was 100% full. Wherever I attempted to install the LFA where space was available it still complained as it was checking /tmp for space.

So, what am I to do? I thought about using the SCALA local LFA and trying out the remote SSH pull method but then I recalled a recent client request to show a simple approach for sending a log file from a remote system as if they were running a tail -F on that remote system and sending the log to SCALA. In their case, they didn’t want burden their end user with having any requisite knowledge of the LFA, how to install or configure it. Makes sense to me.

So, with a little Google-foo I can show you how to use netcat to execute a tail -F on a remote system file and stream that to the SCALA system where netcat is listening and creates a local copy of that remote system file which is picked up for indexing in SCALA.

Notes:

  • Be aware of your corporate security policies!
  • The contents of the file to be streamed across the network are not encrypted. (there are variants of netcat that support ssl, encryption techniques, stunnel, etc.)
  • There are other methods that could be used to copy a file from one system to another in a batch mode that are secure. (e.g via ssh)
  • I’m using a RedHat and SLES system here. I used ‘nc’ on RedHat (nc v1.84) and ‘netcat’ on SUSE (netcat v1.10). I didn’t spent any time investigating versions or differences.
  • There are a few different timeout options that look interesting depending on your scenario.

What we’re Building

In this common log shipping and log analysis scenario, I have a WebSphere Application Server (WAS) on a remote system and it’s writing to a SystemOut.log file in a common location. I want to stream the log records from that WAS SystemOut log to the SCALA server for indexing enabling search and custom app visualization.

SendingLogsToSCALAwithNetCat

Getting Started

Verify that you have netcat installed on each system. Simply type ‘netcat’ or ‘nc’ to get a response. If not, find a suitable netcat|nc package for your OS.

SCALA System Side

On the SCALA server side we’re using netcat in a listener mode on a specified port. We start netcat in listen mode by using the –l option. Also in this case, we’re going to start ‘nc’ using the –d option so we can send the command to the background and ignore anything on STDIN. Remember, the port in use needs to be higher than 1024.

The power of netcat comes next when we redirect the output received from listening on the specified port and write that to a file on the SCALA system. In this case, we’re conveniently creating and writing to the log in the [SCALAHOME]/logsources/WASInsightPack/ directory so it’s automatically picked up by the local SCALA LFA and indexed by SCALA.

The command we’ll execute looks like this: (change to fit your environment)

nc –dl 1235 > /opt/scala/driver/logsources/WASInsightPack/SystemOut-165.log &

Remote System Side

One the remote system, identify the log file of interest. In our case, we’re using the standard SystemOut.log for the WAS server. On this system we’re going to execute the tail –F command on that file and pipe it into the ‘nc’ command for sending over the network. We use the –F flag for tail so it follows any logfile that gets rolled over. You could just as easy use ‘cat’ to send the entire logfile over at that point in time.

This command is piped into the netcat command ‘nc’. We’re specifying the remote SCALA v1102 system IP address 10.10.10.1 and the port we’ll be using in the netcat command issued on the SCALA server as 1235. We’ll send this to the background so it runs all the time. We are tailing a file after all!

The command we’ll execute looks like this: (change to fit your environment)

tail -F /opt/IBM/WebSphere/AppServer/profiles/AppSrv01/logs/TradeServer2/SystemOut.log | nc 10.10.10.1 1235 &

Creating a SCALA Logsource

Before we start up our netcat connections, let’s get a new SCALA log source defined so we’re ready for indexing from the start. Within the SCALA Administrative GUI, create a new logsource for the file. As we’re running netcat on the SCALA server, we’ll just use the local SCALA hostname and the full path and log file name in our log source definition. In our case we’ll use the standard WebSphere SystemOut source type and collection, but you’ll need to choose the appropriate ones for your log type.

Starting up Netcat

Start the netcat listener on the SCALA server first:

nc –dl 1235 > /opt/scala/driver/logsources/WASInsightPack/SystemOut-165.log &

Next, start the netcat client on the remote system:

tail -F /opt/IBM/WebSphere/AppServer/profiles/AppSrv01/logs/TradeServer2/SystemOut.log | nc 10.10.10.1 1235 &

To verify things are working, tail the file you’re creating on the SCALA server side as well as run some queries in the SCALA GUI for the log source you created.

1 comment

Bookmarks for June 25th through October 1st

in General

These are my links for June 25th through October 1st:

  • 13 Ways to Tail a Log File on Windows & Linux | Stackify – It turns out there are a bunch of people on stackoverflow looking for ways to tail a log file but there don’t appear to be many lists of all the different helpful tools to do this. Well I LOVE lists. Check out some tools I found that make tailing a log file a walk in the park:
  • What’s New in Splunk 6 – Real-Time Business Data | Splunk – Splunk Enterprise is the leading platform for real-time operational intelligence. It's the easy, fast and secure way to search, analyze and visualize the massive streams of machine data generated by your IT systems and technology infrastructure—physical, virtual and in the cloud.

    Splunk Enterprise 6 is our latest release and delivers:

    Powerful analytics for everyone—at amazing speeds
    Completely redesigned user experience
    Richer developer environment to easily extend the platform

  • Announcing the Release of Splunk Enterprise 6 | Splunk Blogs – Splunk Enterprise 6 introduces new analytics features to open up machine data analytics to literally anyone in your organization. The new Pivot interface allows business or non-technical users to easily manipulate, interact and visualize machine data without using the search language, easily allowing anyone to now use Splunk Enterprise as their analytics playground. Joris Vuffray, from Swisslos, called it “game changing”— a testament to the extensive beta program and the value customers are seeing.
  • Sumo Logic’s Automatic Anomaly Data Detection – Learning, Big Data, and Cloud | SiliconANGLE – Sumo Logic’s Anomaly Detection service gives customers a number of capabilities including:

    Identify imminent security threats
    Detect anomalies across the entire application and operations infrastructure
    Provide user feedback to turn anomalies into known events and classify events with the appropriate severity levels
    Detect any future events that match the patterns associated with past anomalies
    Visually identify and track anomalies, corresponding events and underlying log patterns through an Anomaly Dashboard
    Use LogReduce to rapidly investigate and identify the root cause of these events
    Set alerts for users whenever an important event appears
    Scale anomaly detection to the scope of users’ IT infrastructure

  • Mosh: the mobile shell – mobile shell)

    Remote terminal application that allows roaming, supports intermittent connectivity, and provides intelligent local echo and line editing of user keystrokes.

    Mosh is a replacement for SSH. It's more robust and responsive, especially over Wi-Fi, cellular, and long-distance links.

  • Logentries snags $10M to build out and market its Splunk competitor — Tech News and Analysis – Logentries, a Boston-based log monitoring and management company with roots in Dublin, Ireland, now has $10 million in Series A funding to staff up and start marketing its service for real. It already claims it’s processing 28 billion log events daily from 1,000 paying customers — including The Financial Times, Hailo, Engine Yard and Airbrake in 100 countries.
  • VictorOps – VictorOps is the world’s first collaborative platform designed especially for DevOps teams that combines the power of people and data to solve IT problems as they arise.

    By seamlessly orchestrating team situational awareness, incident creation, escalation, notification and remediation, the VictorOps platform increases group communication and decreases problem-solving time.

  • Big Data Predictive Analytics with Enterprise R – Revolution Analytics
  • Structured Logging in Python — structlog documentation – structlog makes structured logging in Python easy by augmenting your existing logger. It allows you to split your log entries up into key/value pairs and build them incrementally without annoying boilerplate code.
  • Logstash 1.2.0 (Upgrade notes included) – This week Logstash 1.2.0 has been released with exciting new features. Logstash is (from the Website): "[…] a tool for managing events and logs. You can use it to collect logs, parse them, and store them for later use (like, for searching). […]"

    The full Changelog can be found on Github, here is a short list with some more details:

  • Loggly raises $10.5 million in hot machine data space – San Francisco Business Times – Loggly, a provider of machine data collection and analysis tools, has secured $10.5 million from Cisco Systems, Data Collective Venture Capital, and prior investors Trinity Ventures, True Ventures and Matrix Partners.

    The latest round brings to $20.9 million the total raised by San Francisco-based Loggly since the 23 person company was founded in 2009.

  • Stratalux releases a Logstash based log management service, available for immediate implementation on AWS Marketplace – tratalux, a leading provider of managed cloud services has released a Logstash based open-source IT log management solution for companies who want the benefits of a centralized logging solution without the enterprise software price. Logstash, an open-source alternative to more costly enterprise IT logging solutions, provides a centralized and scalable repository for all of your system and application logs, providing customers a unique and holistic view into their infrastructures. Stratalux's Logstash AWS Marketplace AMI has been configured with all the basic components necessary for a comprehensive working solution. Included in this AMI are the Logstash server, Kibana web interface, ElasticSearch storage and Redis data structure server. Simply launch Stratalux’ Logstash AMI with the click of a few buttons and install and point your Logstash agents to this AMI to begin searching through your logs. Additionally the creation of customized dashboards will provide new insights into your inf
  • Loggly.com : Responsive Log Management Behind the Screens | Loggly.com : Responsive Log Management – Today we announced the next generation of Loggly. We on the Software Infrastructure are really excited now that our code is publically ingesting, analysing, and indexing customer log data. So what did we use to build our new system? I thought it might be fun to share some high-level details. I’ll discuss each of these in more detail in future blog posts, but let’s stand back and see what’s going on.
  • CoreOS – Minimal

    Linux kernel + systemd. That's about it. CoreOS has just enough bits to run containers, but does not ship a package manager itself. In fact, the root partition is completely read-only, to guarantee consistency and make updates reliable.

  • Splunk Inc (SPLK): Splunk runs PM, analysts weigh in – Seeking Alpha – Splunk runs PM, analysts weigh in

    Splunk (SPLK) shares are up 9.9% PM after the company delivered a beat and raise Q2.
    FBR upgraded Splunk to Outperform from Perform and hiked the PT to $61 from $48. "We believe the potential 'game changer' in the Splunk story is around early signs of a step-up in enterprise deals, which could add major fuel to the company's growth engine."
    Needham raised its PT to $55 from $50 and maintained a Buy rating. Scott Zeller believes Splunk has the potential to maintain its torrid growth as existing customers (70% of license bookings) get "deeper" into Splunk, the "non-IT" side of the business expands, and the company moves into the "large … non-US opportunity for Big Data."
    Wedbush raised its PT to $60 from $58 and kept an Outperform rating. Steve Koenig: "[C]onsensus revenue estimates are much too conservative for this year and next, as they anchor on cautious management guidance."

  • Welcome Jordan & Logstash | Blog | Elasticsearch – Today is a defining day in the history of our company: We are proud to announce that Jordan Sissel, the creator of Logstash and a good friend, is joining Elasticsearch! This means that Elasticsearch, the company, now provides a fully open source product stack for logging and events management: Logstash for log processing, Elasticsearch as the real time analytics and search engine, and Kibana (created by Rashid Khan) as the visual front end.

    Neither Jordan nor Logstash really need an introduction, but I’d like to give you an idea about why this is amazing news for so many Elasticsearch and Logstash users.

  • Centralized Log Archiving with Logstash » Linux Magazine
  • Splunk Storm – Machine Data Processing in the Cloud | Architects Zone
  • Syslog-NG RepoView: “Fedora EPEL 6 – x86_64”
  • zlogd
  • Introducing Zlogd – An open source universal logging agent
0 comments

Read part one of this blog series here.

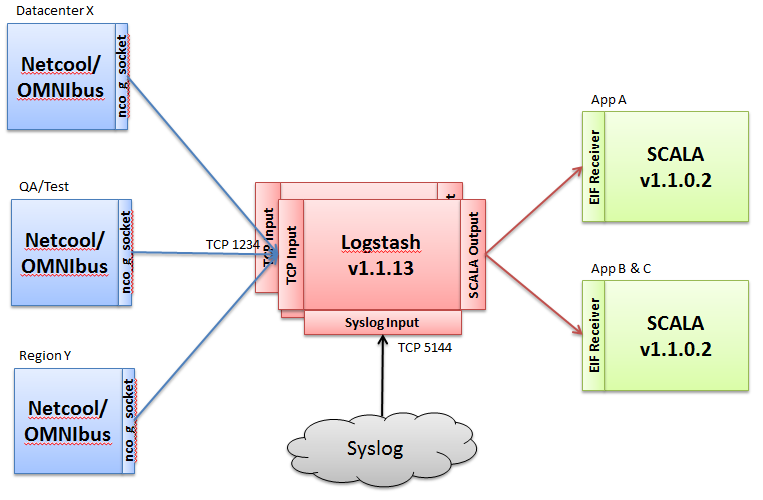
Here’s an overview of what we’re building a slice of. You can simply start with what you have but you can see how this can be stamped out cookie cutter style to support many different architecture patterns in your environment. In larger environments there are obvious scale and performance considerations that should be considered for each component in the flow. Fortunately, each component has decent capabilities for filtering and throttling down event flow load.

EventAnalysisWithSCALAOverview

What’s Required

  • SCALA v1102 core application
  • SCALA v1100 DSV Tool Kit
  • SCALA v1100 Logstash Tool Kit
  • Logstash v1.1.13 (we don’t support the v1.2.x version yet)
  • Netcool/OMNIbus Socket Gateway (Netcool/OMNIbus Gateway for Socket (nco-g-socket 10_0) for Linux – English (CI5FZEN)) – download from your authorized source.
  • Familiarity with your Netcool/OMNIbus alerts.status schema
  • Familiarity with common gateway configuration steps such as editing the .props file, socket map file and socket.reader.tblrep.def
  • Netcool/OMNIbus (any version should work)
  • Servers – doesn’t everyone have these lying around now?

SCALA v1102

Let’s start with getting SCALA installed and in place. I’ve talked a number of times on the basics of installation of SCALA. It’s been designed to be as simple and quick as possible so I won’t spend time here on this.

Download the following:

  • SCALA v1102
  • DSV Toolkit v1100
  • Logstash Toolkit v1100 (we’ll install this later)

My preferences are to create a user and group named ‘scala’ and to install into a directory named ‘/opt/scala’ which contains a directory for ‘builds’ (software packages, etc.) and one for ‘driver’ (the install target). I always install via the console or silent install process and simply point to my preferred install target.

For the DSV Toolkit, copy the zip file to the [SCALA_HOME]/unity_content directory and unpack it. You’ll end up with a [SCALA_HOME]/unity_content/DSVToolkit_v1.1.0.0/ directory.

We’re all set with the basics and we’ll come back and configure things in more detail in an upcoming post. The next post will focus on the installation of Logstash v1.1.13.

0 comments