Many application development, support and operations environments are undergoing significant transformation from programs and initiatives such as DevOps, Agile/Lean, Virtualization and Cloud Computing. Over the past few years, companies, communities and people have rapidly sprouted up and created entirely new categories of technologies, tools and operational practices that are enabling them to leap frog traditional slow to transform incumbents. Terms like “born on Internet” or “born on Cloud” nicely describes the differences here.
There are dozens of exciting new technologies and tools emerging from the DevOps community that are now being widely adopted by not only those “born on Internet/Cloud” type companies but traditional enterprises as they mature through their technology transformation programs like Cloud. Vendors like IBM are now openly embracing the same to radically simplify and accelerate application delivery, support and operations by adopting those same tools and techniques enabling broader integration and adoption. Many of these are now being seen through IBM’s participation in industry groups like OpenStack or OSLC and exposed in open, transparent beta programs like Jazz for Service Management, Cloud Consumer Monitoring and the new IBM Log Analytics open beta programs.
With that, I’ve been spending a lot of time in this area getting close to application developer, support and operations teams to really understand how they work today in both traditional and emerging technology environments. I’ve started exploring and applying these same tools and technologies with the simple goal of how to introduce a repeatable process they can use for exploring IBM Log Analytics using tools and techniques they’re likely already familiar with. I want to remove any barriers to participation in our open beta program. For more information on IBM Log Analytics and the open beta program, please visit this webpage.
Vagrant is one of these new tools. From the project website, “Vagrant provides easy to configure, reproducible, and portable work environments built on top of industry-standard technology and controlled by a single consistent workflow to help maximize the productivity and flexibility of you and your team. To achieve its magic, Vagrant stands on the shoulders of giants. Machines are provisioned on top of VirtualBox, VMware, AWS, or any other provider. Then, industry-standard provisioning tools such as shell scripts, Chef, or Puppet, can be used to automatically install and configure software on the machine.”
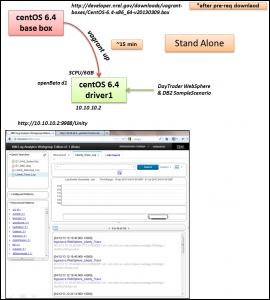
The following blog post describes how I have used Vagrant and VirtualBox to go from a bare bones image to fully installed, ready to use instance of IBM Log Analytics open beta milestone driver in just about 15 minutes right on my laptop. If you are one of our targeted end users in an application development, support or operations groups or a subject matter expert on a WebSphere or DB2 team this approach will allow you to quickly get started in the IBM Log Analytics open beta program. By the way, you do not need to be an IBM customer – just sign up for a My IBM account here (upper right corner).
Lets get started!
Install VirtualBox
Vagrant uses a provider concept which is simply the back end virtualization platform providing key image or “box” administration and operation capabilities. VirtualBox looks pretty similar to VMWare Workstation to me so I was pretty familiar with using it. Support for the use of VirtualBox is provided with Vagrant so we’ll use this as our base virtualization capability.
Swing your browser over to the Virtual Box website located here. I installed the Windows version but it’s also supported on Linux and Mac so all of the common application developer and support engineer bases should be covered.
Install Vagrant
The Vagrant installation is quick and installation packages are available here for all of the preferred application developer and support engineer OS platforms. In my scenario, I chose the Windows package. Vagrant is a command line based interface for creating and managing boxes so you won’t find a GUI for Vagrant. You’ll be working in your terminal window when using Vagrant along with your favorite editor when creating your Vagrantfile and provisioning scripts.
Create and Initialize a Vagrant Project Directory
To get started with VirtualBox and Vagrant we begin by creating a new Vagrant project directory and running the vagrant init command within that directory. This initializes the current directory to be a Vagrant environment and creates a default Vagrantfile within that directory.
Customize Project Vagrantfile
The beauty of Vagrant comes from the ability to describe our virtualized system (“box”) and how we want it built and provisioned with desired environment, packages and software within the Vagrantfile and associated provisioners. Some refer to this as “infrastructure as code” as we’re automating every aspect of building our development, test and operations environment in a configuration file or script.
I’ve placed the Vagrantfile that I’ve used on my git repository here.
Specify a Box
There are a number of publicly available “boxes” available on the Internet that you can use to bootstrap your Vagrant environment. At this time, IBM Log Analytics is only supported on Red Hat 5 & 6 64bit systems. If your organization actively uses Red Hat you likely have the required licenses and support agreements in place and you can create Red Hat images for Vagrant. If you don’t, then an unofficial alternative is to use CentOS 5 & 6 64bit.
For those who may not know about CentOS here’s a brief introduction from the CentOS website.
CentOS is an Enterprise-class Linux Distribution derived from sources freely provided to the public by a prominent North American Enterprise Linux vendor. CentOS conforms fully with the upstream vendor’s redistribution policy and aims to be 100% binary compatible. (CentOS mainly changes packages to remove upstream vendor branding and artwork.) CentOS is free.
In most cases, all that’s required to successfully use CentOS instead of Red Hat is to spoof the installation manager by modifying the /etc/redhat-release file to reflect a supported Red Hat version.
If you want to create your own Vagrant “box” based on Red Hat or CentOS, I recommend installing veewee and following any of the great tutorials on the Internet. For the purposes of my experiments, I’m using a CentOS 5.8 64bit box provided by Puppetlabs. Other boxes are available here.
Add the following line to your Vagrantfile to specify the name of the box to be used.
config.vm.box = "Puppetlabs CentOS 5.8 x86_64"
Specify Box Location
As I’m using a publicly hosted base box, I need to specify where Vagrant will download the box from. When Vagrant is started using the up command for the first time, this base box is downloaded and stored in a location outside of your specified project directory. The box image is always kept whole and is now available for any number of Vagrant projects you decide to spin up. Every project that I create and use the box name from above will simply import the previously downloaded box and use a copy of that.
Add the following line to your Vagrantfile to specify where to download the box.
config.vm.box_url = "hhttp://puppet-vagrant-boxes.puppetlabs.com/centos-58-x64.box"
Configure Port Forwarding
By default, Vagrant will spin up the box with basic localhost (127.0.0.1) networking support. To access the guest image we need to configure port forwarding from the host to the guest for any of the ports we may need access to. SSH forwarding to port 22 is set up automatically. We’ll just need to setup port forwarding for the main IBM Log Analytics port 9988.
If you get hooked on Vagrant and spin up multiple boxes like I have been, you’re going to run into port collisions. Vagrant will automatically detect port collisions and set new ports for you nicely telling you during start up what the new ports are. You can always change these in your Vagrantfile or in the VirtualBox admin GUI.
Add the following line to your Vagrantfile to configure port forwarding.
config.vm.network :forwarded_port, guest: 9988, host: 9988
Customize the Box
Every Vagrant base box is preconfigured with a specific number of CPUs, memory, disk and other typical system specifics. The base image I’m working with comes with 1 CPU and 384MB of memory which isn’t practical for doing much with IBM Log Analytics. At a minimum you should provision your base box to start with 2 CPUs and 4GB of memory. Depending on what you plan to do and what system resources you have on your host system, adding more will not hurt! For more base box customization options, review this page.
Add the following lines to your Vagrant file to provision the base box for this project.
config.vm.provider :virtualbox do |vb|

vb.customize ["modifyvm", :id, "--name", "scla-driver1", "--memory", "4000", "--cpus", "2"]

end
Enable Provisioning
Another powerful capability of Vagrant is to define exactly what should happen after the base box is spun up. This is typically the configuration of common system environment settings, hosts files, profiles, etc. as well as running an update program such as ‘yum update’ to ensure the environment is patched to the current level. Beyond the common system level provisioning, the automated installation of packaged software, applications and configuration of those is something Vagrant allows for within the Vagrantfile through the provisioner capability. For my initial use case, a simple bash script provisioner was used. I look forward to learning more about Puppet/Chef in the near future as an alternative to simple script provisioners, but for now I’m keeping it pretty simple.
Add the following line to configure the shell script that will be executed to provision our IBM Log Analytics testing environment. The script is described in more detail in the next section.
config.vm.provision :shell, :path => "vagrant_scla_provision.sh"
Vagrant Provisioning Script
Let me paint a picture here of the value I see from using Vagrant during the open beta program as well as within the application developer or support engineer’s toolbox for supporting individual business applications.
Over the course of the IBM Log Analytics open beta program, multiple milestone drivers will be offered. Each driver will require some level of installation and configuration before it can be used, tested and evaluated in your environment. At this time, there isn’t an export/import/migrate capability so you’ll be running through the same install and configure steps manually for each driver you test. Using Vagrant and provisioning scripts this process can be radically simplified and automated allowing you to quickly get to value expected from using the software and not spending hours or days trying to get a system built, old software uninstalled, new software installed, configured and integrated. Removing barriers to participation is the goal here!
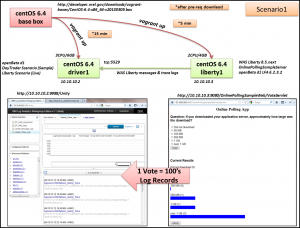
Beyond the open beta program, using Vagrant with the IBM Log Analytics Workgroup Edition as an application developer or support engineer you can quickly stand up and provision an instance of IBM Log Analytics for business application #1 and spin up another for business application #2 in a matter of minutes. Each box would have the necessary software installed, configured and integrated to consume each business application’s logs automatically, with little to no action beyond executing the ‘vagrant up’ command. Now that’s POWERFUL!
I wrote a very simple bash script that mimics the workflow that I took to manually install the IBM Log Analytics milestone driver #1 on this CentOS 5.8 base box. It’s rough and dirty, but functionally works. The following are the key steps taken in the script. If anyone has suggestions for improving this script shoot them my way! The script is available on my git repo here.
- Capture username and password for installation user
- Capture ILA driver file name
- Turn off SELINUX within the selected base box (it’s on in the CentOS box I used)
- Modify /etc/redhat-release to spoof installation manager
- Install a compatibility library for the ITM LFA
- Create installation user and group
- Create installation directories
- Copy ILA driver to installation directory and explode tarball
- Change ownership of all directories and files to the install user:group
- Install the ILA driver using silent install method
- Install the sample scenario data
ILA Driver Silent Installation File
Included in the IBM Log Analytics milestone driver package is an example silent install response file (sample_smcl_silent_install.xml). I’ve completed the configuration of this file by following the docs here. This will allow us to install the IBM Log Analytics package in a completely automated manner using our Vagrant provisioning script.
The silent install response file I used is available on my git repo here.
Copy Files to Vagrant Project Directory
Before we spin up the box all of the files we will use for provisioning must be placed in our project’s root directory. This is the same directory where you issued the ‘vagrant init’ command earlier.
Copy the following files into the Vagrant project directory:
Initialize and Provision Box
We’re now ready to spin up and provision our initial version of IBM Log Analytics and begin testing the first driver for our open beta! From your Vagrant project directory, simply issue the ‘vagrant up’ command. You may want to make sure you have enough buffer in your terminal window so you can scroll back and see all of the things that took place during this process.
Issue ‘vagrant up’ now!
I recorded my terminal window so you can watch the entire sequence. It took about 15 minutes to complete on my system (I edited out the longer pauses of the build process). With a nice beefy box and ample CPU/MEM on the base box image I’m sure it would be quicker.
Verbose Terminal Window of Vagrant Spin Up and Provisioning
Browser Support
The current supported browser at this time is the Firefox 17 ESR version. You may have your preference of browser by choice or by corporate policy but one trick I’m a huge fan of is to make use of Portable versions of the Firefox browser. It seems that I need to have a number of versions of Firefox to achieve the best user experience and performance with various products I use frequently. Portable apps are versions of common applications that can run independently from a standalone folder instead of actually being installed in your system. I actually run up to three versions of Firefox at the same time for some of my testing work.
To download the supported version of Firefox for this driver, visit this link to find Firefox 17.0.x ESR.
Accessing IBM Log Analytics
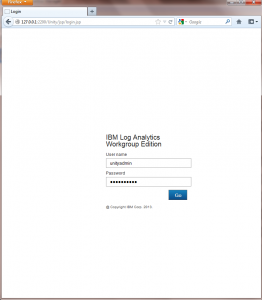
Fire up your browser and point it to the address you configured for your box. I’ve left this to the default network so I just point my browser to http://127.0.0.1:2200/Unity and I’m presented with the login page. Note the use of 2200 as the local port which is forwarded to 9988 to reach the main IBM Log Analytics webserver port. If you’ve set your forwarding up for 9988 -> 9988 then point your browser to http://127.0.0.1:9988/Unity to connect. This should redirect you to http://127.0.0.1:9988/Unity/jsp/login.jsp to actually log in.
The default passwords are unity/unity or unityadmin/unityadmin.
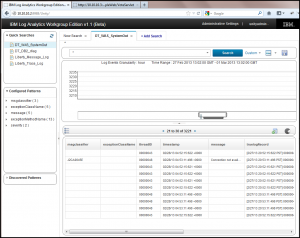
Here are a few example screenshots:
Login Page

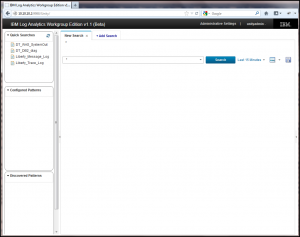
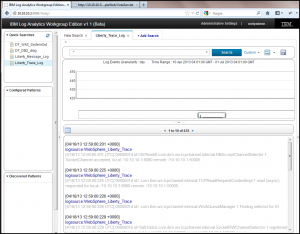
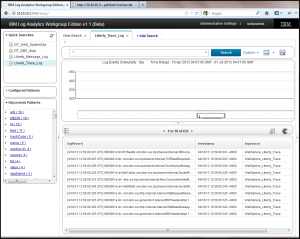
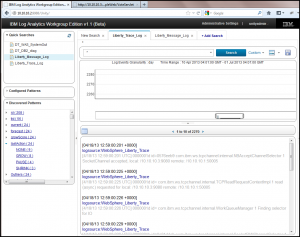
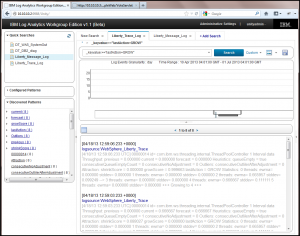
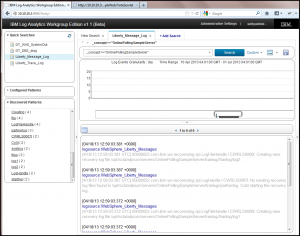
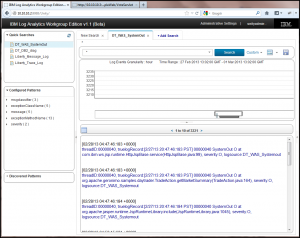
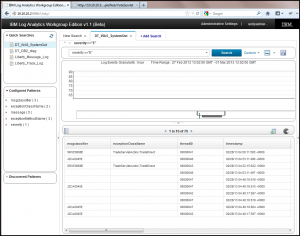
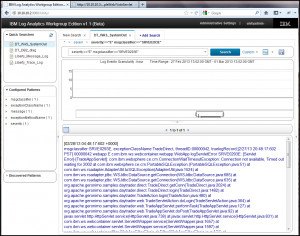
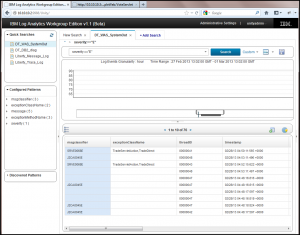
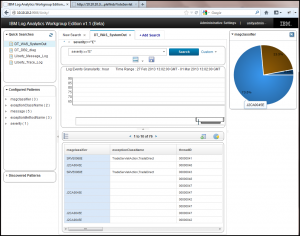
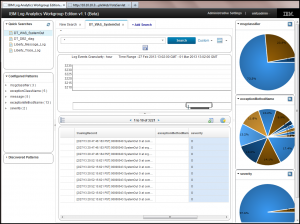
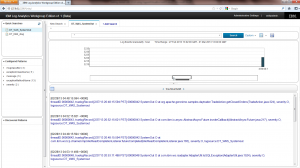
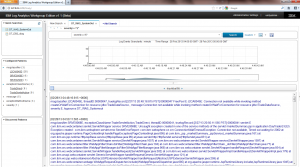
Upon successful login, I’m able to immediately begin to use IBM Log Analytics because I’ve automatically loaded the sample scenario data. I’m able to immediately begin executing searches (saved or freeform) across the sample data. Here are a few example screenshots.
Saved Search

Directed Search Using Configured Patterns

Administration Page

Vagrant Box Teardown
Now that we’ve build and provisioned a fully functioning instance of IBM Log Analytics we have a few options on what we can do at the end of the day. Vagrant offers three options on what to do with the box and the work done during provisioning and customizations you may have made afterwards.
The Vagrant documentation explains these options perfectly below.
- Suspending the virtual machine by calling vagrant suspend will save the current running state of the machine and stop it. When you’re ready to begin working again, just run vagrant up, and it will be resumed from where you left off. The main benefit of this method is that it is super fast, usually taking only 5 to 10 seconds to stop and start your work. The downside is that the virtual machine still eats up your disk space, and requires even more disk space to store all the state of the virtual machine RAM on disk.
- Halting the virtual machine will gracefully shut down the guest operating system and power down the guest machine. You can use vagrant up when you’re ready to boot it again. The benefit of this method is that it will cleanly shut down your machine, preserving the contents of disk, and allowing it to be cleanly started again. The downside is that it’ll take some extra time to start from a cold boot, and the guest machine still consumes disk space.
- Destroying the virtual machine will remove all traces of the guest machine from your system. It’ll stop the guest machine, power it down, and remove all of the guest hard disks. Again, when you’re ready to work again, just issue a vagrant up. The benefit of this is that no cruft is left on your machine. The disk space and RAM consumed by the guest machine is reclaimed and your host machine is left clean. The downside is that vagrant up to get working again will take some extra time since it has to reimport the machine and reprovision it.
Starting or Resuming a Previously Provisioned Box
If you’ve suspended or halted your Vagrant box, you’ll want to be sure to start it back up using an additional flag to avoid having the provisioning script run again. To prevent re-provisioning a box after you’ve done it once, use the –no-provision flag
vagrant up --no-provision
Summary
One of the goals for the open beta program is to make IBM Log Analytics as accessible and simple to use as possible for the targeted application developer, application support engineer or middleware subject matter expert. Using Vagrant, VirtualBox and automated build and provisioning capabilities can help remove all barriers from participating in the IBM Log Analytics open beta program.
Over the next few months I’ll write more about how Vagrant can be used to build out an IBM Log Analytics architecture that can be used in your application development, test and production environments. I’ll expand on the topic by introducing additional log shipping, collection, consolidation and analytics products, integrations, automations using emerging open source technologies alongside commercial software such as IBM Log Analytics.
* Updated 4/8/13 after making changes to my Git repo, URLs now point to a folder versus individual files.

