Nagios (Core/XI) is one of the top 5 most widely integrated tools across PagerDuty’s 10K+ customers providing fundamental host and service monitoring and alerting capabilities. During my time here at PagerDuty, I’ve had the opportunity to work with very very large and
From what I’ve seen, many of PagerDuty’s customers take a “set it and forget it” approach in their integrations. They’ve followed the super simple integration guide (e.g. Nagios XI) and created a “monitoring service” in PagerDuty. In this configuration, Nagios host or service templates are updated to send all Nagios alerts to one single PagerDuty service integration key (the “PagerDuty Contact”
When I say “set it and forget it”, what I’m really saying is that the integration well-established up so quickly and ‘just works’, that teams just
What I’d like to drill in on here are a few of these default configurations and their resulting alert, incident and reporting artifacts within PagerDuty and the operational implications over the next few blog posts how to move beyond the defaults to a best practice configuration in both Nagios and PagerDuty.
The Guts of the Nagios XI – PagerDuty Default Integration
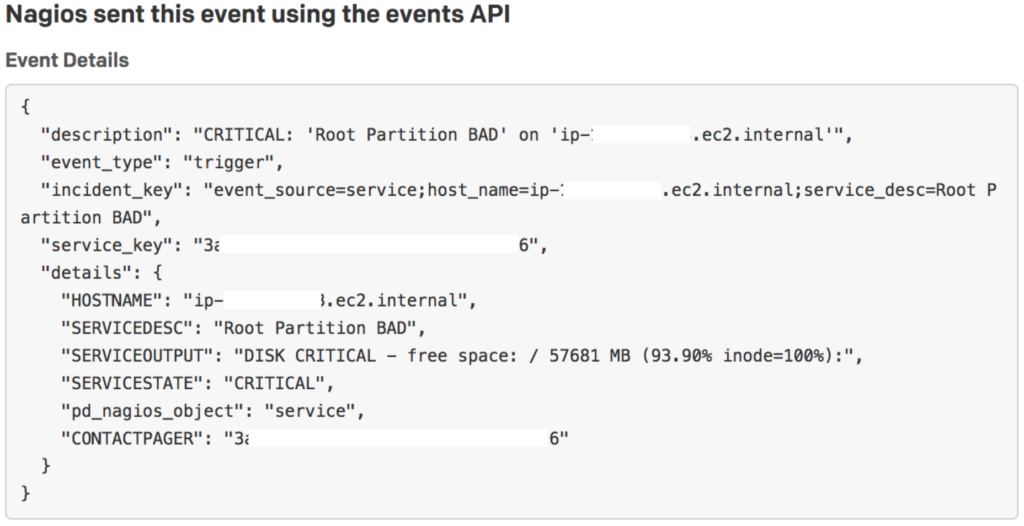
The core of the PagerDuty – Nagios XI integration comes down to two parts, the Nagios XI Contact configuration and the Nagios XI Command (and associated pd-nagios python script). Essentially, the contact defines the alert notification conditions and whom (or what) to send the notification details to and the command receives the alert notification metadata (via Nagios macros) and passes this data into the pd-nagios script resulting in a post to the PagerDuty Event API v1.
In the service notification example below, when a service alert is triggered on a host, the configured contact alert conditions are evaluated the service notification command is executed. The default ‘notify-service-by-pagerduty’ command is called passing in a number of parameters to the pd-nagios python script.

Command Line: /usr/share/pdagent-integrations/bin/pd-nagios -n service -k $CONTACTPAGER$ -t “$NOTIFICATIONTYPE$” -f SERVICEDESC=”$SERVICEDESC$” -f SERVICESTATE=”$SERVICESTATE$” -f HOSTNAME=”$HOSTNAME$” -f SERVICEOUTPUT=”$SERVICEOUTPUT$”
This simple Nagios command and associated executable script and parameters
-n [service|host]: notification_type: This parameter is used to signify if this is a service or host notification from Nagios. It’s used in the
-k $CONTACTPAGER$: This is the
-t $NOTIFICATIONTYPE$: A string identifying the type of notification that is being sent (“PROBLEM”, “RECOVERY”, “ACKNOWLEDGEMENT”, “FLAPPINGSTART”, “FLAPPINGSTOP”, “FLAPPINGDISABLED”, “DOWNTIMESTART”, “DOWNTIMEEND”, or “DOWNTIMECANCELLED”). This macro value maps into the PagerDuty Event API v1 event_type field. Nagios XI “PROBLEM” maps to event_type ‘trigger’, “ACKNOWLEDGEMENT” maps to event_type ‘acknowledge’ and “RECOVERY” maps to event_type ‘resolve’.
-f $SERVICEDESC$: The long name/description of the service (i.e. “Main Website”). This value is taken from the service_description directive of the service definition. This macro value is used in the PagerDuty incident description, alert key, service and custom details fields.
-f $SERVICESTATE$: A string indicating the current state of the service (“OK”, “WARNING”, “UNKNOWN”, or “CRITICAL”). This macro value maps into the PagerDuty Event API v1 severity field and is used in the PagerDuty incident description, severity, state and custom details fields.
-f $HOSTNAME$: Short name for the host (i.e. “
-f $SERVICEOUTPUT$: The first line of text output from the last service check (i.e. “Ping OK”). This macro value is used in the PagerDuty incident service output and custom details fields.
The results of the Nagios XI – PagerDuty Default Integration
Let’s explore how this default Nagios XI – PagerDuty integration looks as seen in various places the alert and incident could be displayed. We’ll use this Nagios XI alert as the example.
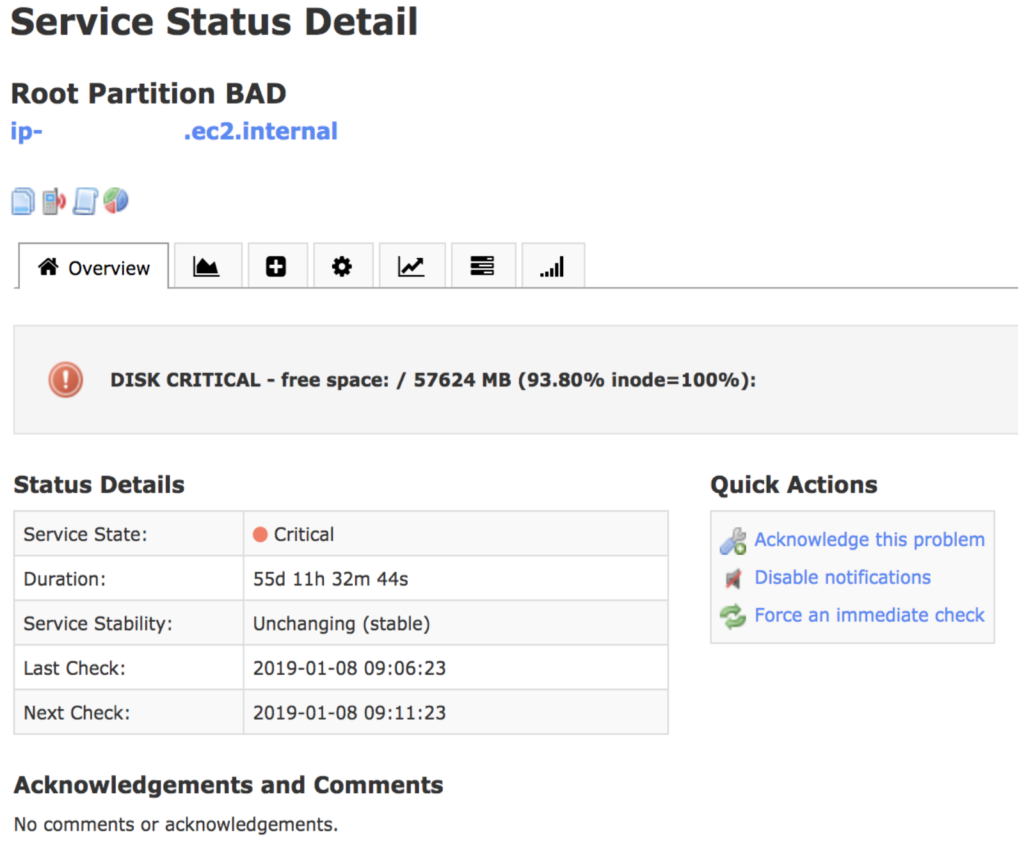
This Nagios XI disk alert will trigger the ‘notify-service-by-pagerduty’ command and pass the macro values to the PagerDuty Event API v1 resulting in a new PagerDuty alert.
This is the resulting PagerDuty alert display within the Alert tab. Note that I customized the column display to show the additional columns that could display alert information.
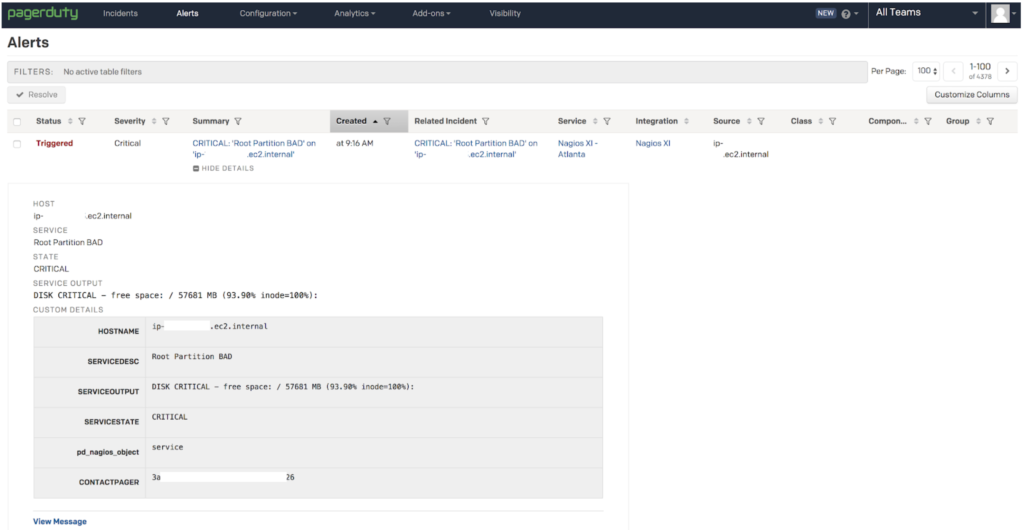
If “View Message” is clicked on in the lower left corner, a portion of the PagerDuty Event API v1 payload can be seen.
By clicking on the alert summary I can open the alert’s detailed display.
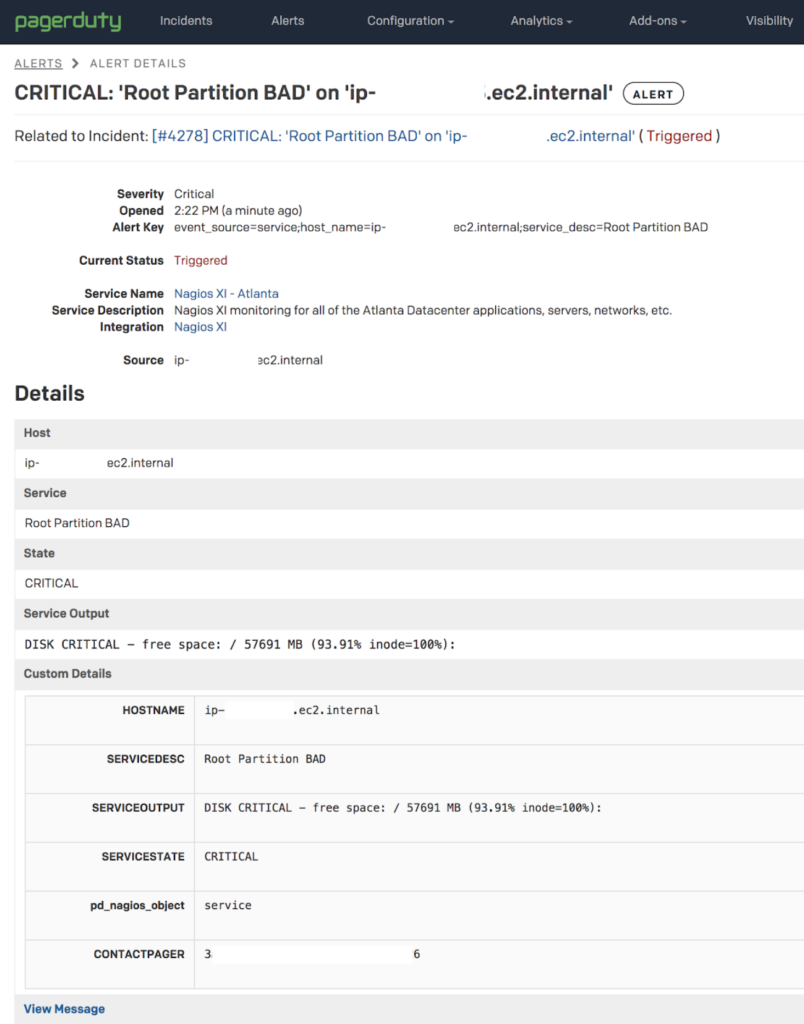
By clicking on the link next to “Related to Incident:”, the PagerDuty incident details is displayed.
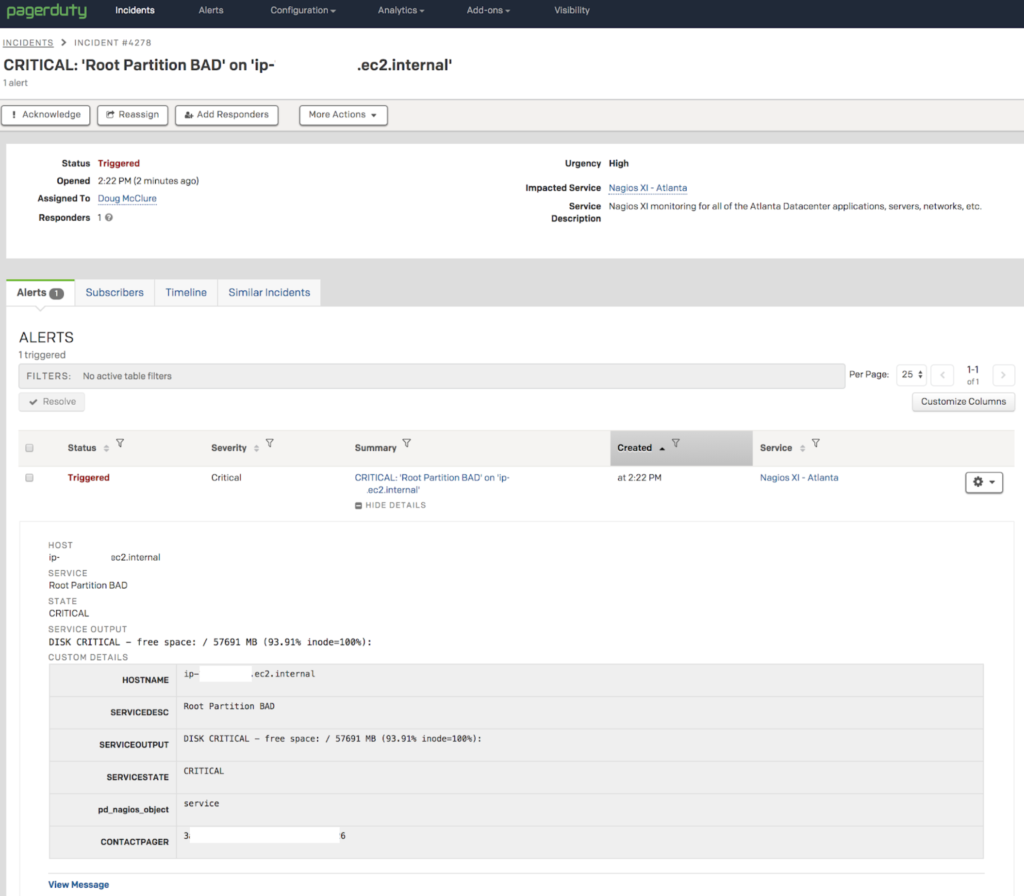
If the PagerDuty user has configured their notification preferences to receive email, this is what they would be sent.

If the PagerDuty user has configured their notification preferences to receive push notifications on the PagerDuty mobile app, this is what they’d see for the incident and alert detail.
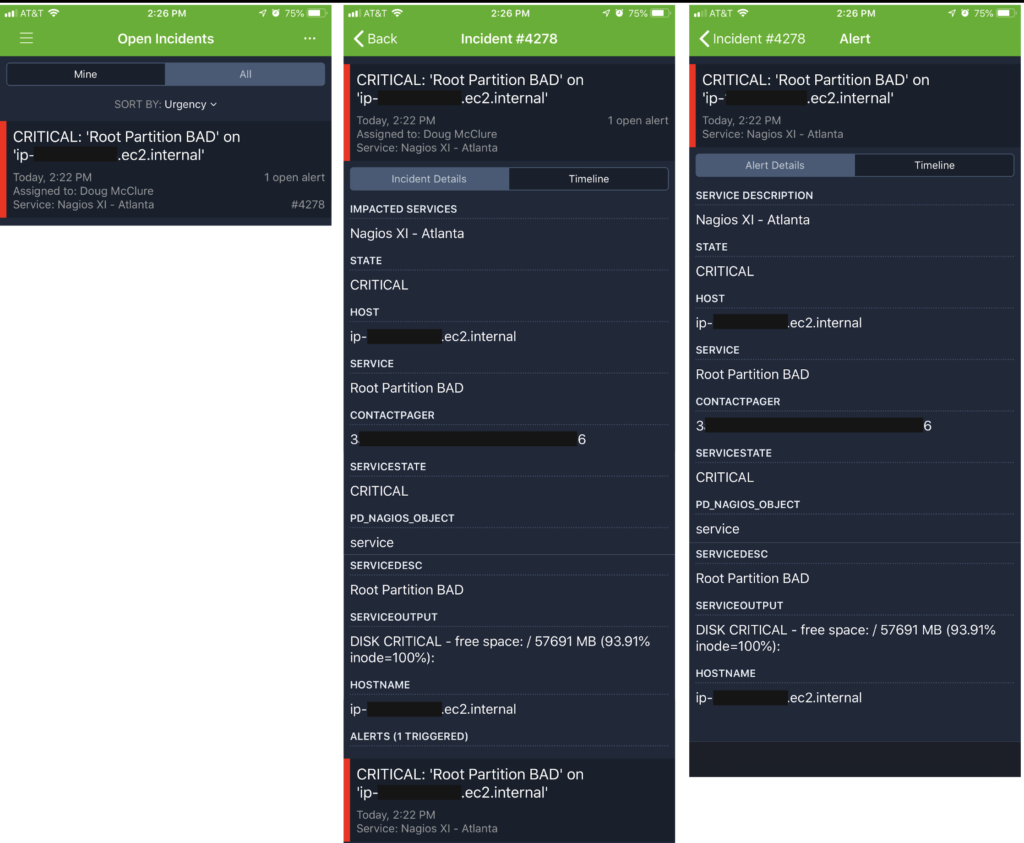
In the next blog post, I’ll call out some of the reasons why running in this default configuration isn’t best practice and how this impacts an ops team’s response when using PagerDuty. I’ll also lay out the next steps that can be taken to move towards better practices when integrating Nagios with PagerDuty.
