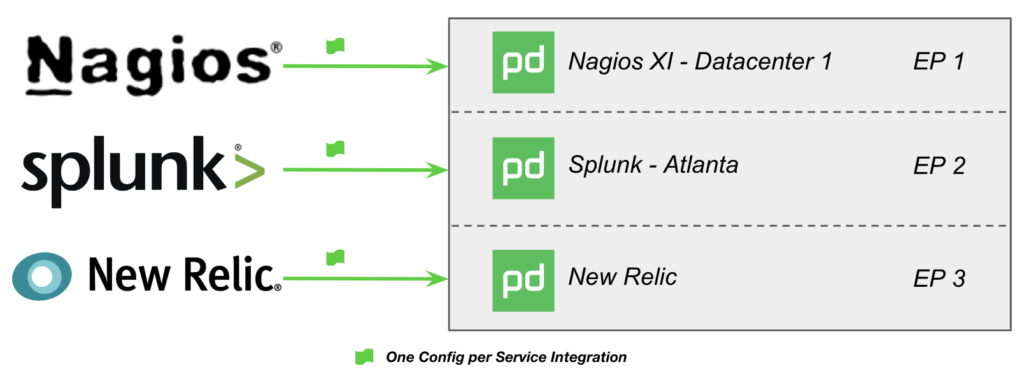
Follow one of PagerDuty’s integration guides for common monitoring tools and you’ll quite easily end up with your very own “Monitoring Service” and open the floodgates for incoming signals, alerts or events from that tool now triggering PagerDuty alerts and incidents. In the end, hopefully, you’ll be paging the right on-call person at the right time! PagerDuty makes it super easy to get started with this design pattern no matter the tool in your environment thanks to over 300+ integrations in our portfolio today.
Your “Monitoring Services” may resemble something like “Nagios XI -Datacenter 1” or “Splunk – Atlanta” or just plain old “New Relic”. I see them in all shapes and sizes across customers in all parts of the world and every industry and size. Internally here at PagerDuty, in addition to calling these “Monitoring Services” we also often refer to them as “Catch All Services”, “Event Sink Services”, or “Datacenter Services” because they do one thing well – catch all incoming signals, alerts or events in one single PagerDuty service and notify someone based upon the single escalation policy associated with that service. Works, but maybe not so well in the long run.

The speed and ease at which you can integrate tools into PagerDuty
If you’d like to apply PagerDuty’s best practices for reducing the sheer number of incidents and notifications in this configuration you can simply turn on Time Based Alert Grouping at let’s say a two-minute grouping window. Group away! Sometime later, the Application Support team reaches out to you confused because there are some weird Cisco Chassis Card Inserted alerts grouped together with their important application incidents. The Storage Ops team pings you in Slack confused by the custom “Front Door Visitor” alert grouped into their DX8000 SAN incident. Time is time and
Ease and speed aside, as you can see above with not so subtle examples that there are a number of drawbacks from following the “Monitoring Service” design pattern and this configuration certainly isn’t a ‘best practice’. Over the next few blog posts, I’d like to take you along on a better practice journey by exploring PagerDuty’s service design best practices and our Event Intelligence product through practical applications when using Nagios XI.
