As previously mentioned in the first blog post in this series, one of the goals for the first release of Smart Cloud Analytics for Applications (SCAA) is to make it as simple to download, install and use as possible. One way I’ve found to accelerate this is to start using the tools found within the application development, support and release dev/ops end user community as they are the target end user personas for the first release of SCAA.
Objective
The use and excitement surrounding Vagrant is rapidly increasing and a vibrant community has emerged allowing for rapid development and support across many platforms. This is enabling application developers, support and release dev/ops teams to quickly create and work within application environments that most closely resembles what might be found in production. What works well for the latest release of a trendy web/social/mobile application can certainly work well for those who work with application management and monitoring tools like SCAA.
This follow on blog post advances the use of Vagrant and SCAA to allow the demonstration of features in a more realistic scenario based manner. You’ll be able to install SCAA in either a stand alone manner or along with another system that has WebSphere Liberty 8.5.next installed with a sample application. All of this has been integrated so logs are flowing in real time, indexed and ready for searching within the SCAA web interface.
Install Virtualbox & Vagrant
We’ll create the base of our development and testing environment by using Virtualbox for our virtualized system platform. This will allow us to easily spin up CentOS 6.4 (or other) based systems for laying down the software in our evaluation scenarios for SCAA. I’ll share how to create a RedHat 6.4 based box in a follow on blog post.
On top of the Virtualbox foundation we use Vagrant. Vagrant is the magic sauce that allows command line level automation for spinning up the base CentOS boxes then automatically provisioning base package requirements, installing and configuring the SCAA OpenBeta software drivers.
Please refer to the previous blog post here if you need a basic install and use overview or the Virtualbox and Vagrant websites for deeper guidance.
Decide on SCAA OpenBeta Driver 1 Deployment Topology
While I’m still trying to figure out the best mechanics for releasing incremental scenarios through git, I’ll release this now and solicit your feedback for improvement, bugs, etc. as I feel it’s working well on my laptop environment for now. I’m getting good feedback from some users so hopefully I’ll become better with the use of git and how to do releases, versioning, branching, etc. there.
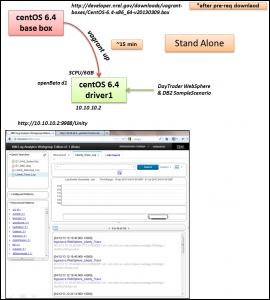
For now, this release allows for two deployment topologies, standalone and what I’m calling scenario1. Standalone is nothing more than SCAA OpenBeta driver 1 now installed on CentOS 6.4 versus CentOS 5.8 as previously blogged about. This option will spin up an image and fully deploy driver 1 and provision the DayTrader sample scenario demo as shown below.
The other option is called scenario1 and is a multi-box scenario featuring the above described SCAA OpenBeta driver 1 box1 plus a new system box2 with WebSphere Liberty 8.5.next installed using a sample Online Polling application. This new box2 will also have SCAA OpenBeta driver 1 LFA installed to send the application logs to SCAA. On the SCAA box1, the appropriate collections, log sources and quick searches are automatically configured allowing immediate search and interaction within SCAA’s main console.
Scenario 1 (shown below) is a great way to see how SCAA will work in your application environment. You’ll get to interact with the data processed via the WebSphere and DB2 Insight Packs as well as log data that doesn’t have an Insight Pack via our Generic Annotation support.
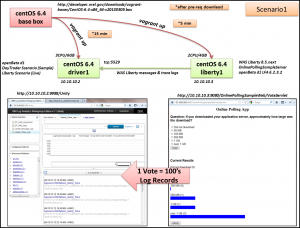
Review the read me on my git hub here for the latest installation procedure. ** Note ** with the help of C835722, we’re refactoring the repository and process to make it much simpler. I’ll update this blog post with those details when I return to the states. For now – the readme on the repo here has the details.
Launch WebSphere Liberty Sample Application
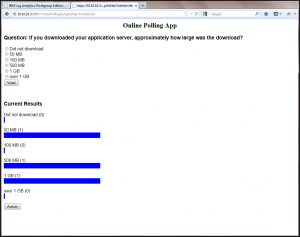
To generate some application logs within the WebSphere Liberty messages and trace logs, launch the Online Polling Sample server app in your browser at http://10.10.10.3:9080/OnlinePollingSampleWeb/VoteServlet.
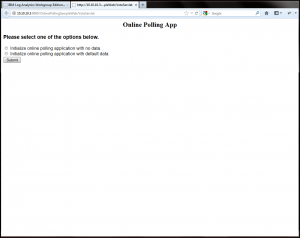
You’ll be presented with a few options to initialize the Online Polling Sample server app. Select one and press the submit button.
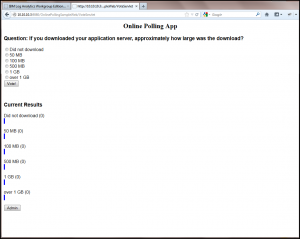
Cast some votes in the sample app. One vote submission will easily create at least 50 log records to be generated based on the level of logging in place in the WebSphere Liberty OnlinePollingSample server.xml file. Feel free to customize this for more or less logging as desired!
Launch SCAA OpenBeta driver 1 UI
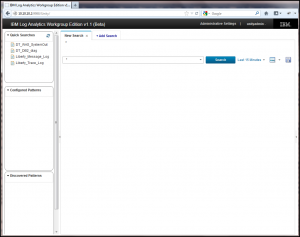
To begin exploring the SCAA OpenBeta driver 1, launch your Firefox 17 browser and point it at http://10.10.10.2:9988/Unity. You will log in with the username of ‘unityadmin’ and password of ‘unityadmin’.
Examine Logs
After logging into the SCAA console, you’ll notice in the upper left corner four quick searches have been created for you. In the SCAA browser window, click on the ‘Liberty_Trace_Log’ Quick Search to see all of the Websphere Liberty OnlinePollingSample application logs within SCAA. Feel free to interact with the results, run wildcard searches across the various log sources, etc.
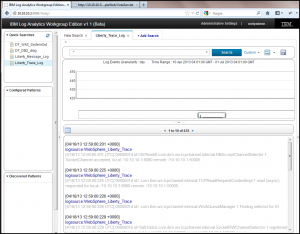
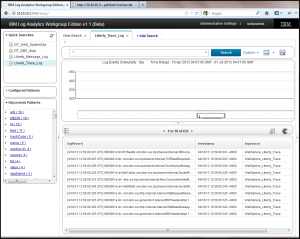
By default, the returned search results appear in a “raw record” like display. Clicking on the grid icon in the upper left corner above the search results will switch you into a grid (or spreadsheet) like view where the first real interaction with search results becomes possible.
Discovered Patterns
Shortly after a quick search or free form search is run, the Configured Patterns or Discovered Patterns sections will begin to populate with key facets found across returned log records. If you clicked on one of the Liberty quick searches, take a look at the ‘Discovered Patterns’ that are automatically created through analysis of the log records.
Discovered patterns are automatically generated through the application of text analytics techniques (e.g. regular expressions, pattern inspection, noise removal) to find those things that are of interest in common log files. In the open beta driver1 release we’re generating discovered patterns in two areas – Concepts and Key Values. I’ll go into more detail in a follow on blog post. For now, just think of this as our smart way of finding things you might want to use as a directed search input to further drill down and around the log data you’re collecting.
We refer to this as our “Generic Annotation” support where we can consume any log source that has a log record which begins with a supported timestamp format. We call this “generic” in comparison to what we develop (and show in the Configured Patterns panel) using Insight Packs and break out into very specific parsed elements for a specific log source and log record format.
If you see a > next to a Discovered Pattern entry, this will be a Key Value Pair that we’ve discovered. You can expand the > to reveal all of the specific value tokens we’ve found in the search results for a given key token.
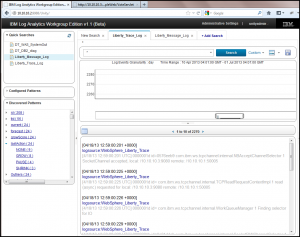
Clicking once on a value token will place that token into the search bar. You can add as many as you’d like by this single click action to construct a specific search pattern of interest. Click on search to execute the search.
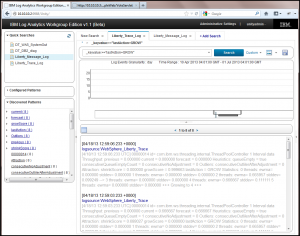
Here’s a close up view of the matched key value pair in the log record:

If you don’t see the > icon next to an entry in the Discovered Patterns panel, then this is a Concept. In the example below, I’ve clicked on the Concept ‘OnlinePollingSampleServer’. With close inspection of the actual log record, you can see that this text appeared in the path to a specific file used in this application.
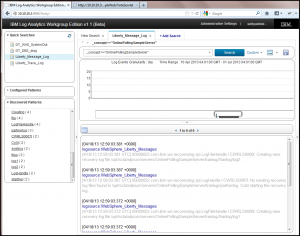
We’d love your feedback on how we can better tune our Discovered Patterns feature. If you have things we should have detected, should be filtering out (noise), etc. please let us know! This feature will continue to be improved over time!
Configured Patterns
Let’s take a look at the Configured Patterns feature now and compare it to what we just walked through for Discovered Patterns. We’ll be using the DayTrader Sample Scenario which includes a sample from a WebSphere Application Server’s SystemOut.log and from a DB2 database’s db2diag log for which we have developed Insight Pack support.
Click on the ‘DT_WAS_SystemOut’ Quick Search. Review and interact with the results. Look at the ‘Configured Patterns’ panel to see the key fields we’re extracting as part of the WebSphere Insight Packs. While the differences might not readily appear to the untrained eye, what’s happening behind the scenes is quite different.
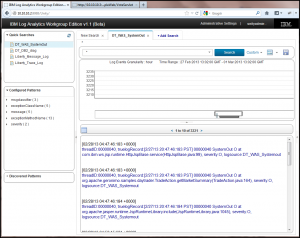
Switch over to the grid view by clicking on the grid icon in the upper left corner above the search results. You should now see (in comparison to what you saw when doing the same for the Liberty logs) that we have a number of very specific columns in our grid.
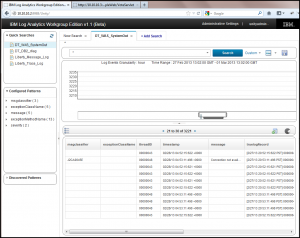
Explore the directed search facets in the Configured Patterns panel. Similarly to the key value pairs in the Discovered Patterns panel, the difference here is that within the Insight Pack we’ve designed the splitting, parsing and annotation logic based on the well known pattern for the SystemOut.log file. Each of the common fields found in a SystemOut.log log record becomes a group within the Configured Patterns panel and all of the discovered values are populated beneath those field names.
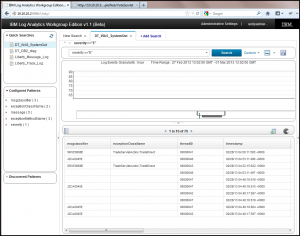
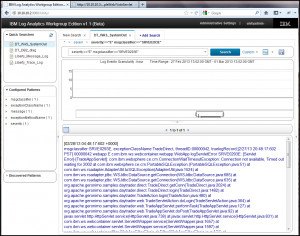
The same can be done for the DB2 logs!
Interacting with Search Results in the Grid View
When you’re in the grid (or spreadsheet) view, you can start to interact with the returned search results. I call this “Analytics Level 1” where you’re able to move beyond the basic search and results display type interactions expected of any product in this space. The most basic interactions that can be done here include the ability to select which columns are displayed (UNFORTUNATELY – at this time we can’t change the order of columns, size of the columns, display name of the columns, etc. I HOPE that we can fix this as this is my #1 annoyance and usability issue!!), perform ascending/descending sort operations across a column and perform column plot analytics (shown below).
To analyze the contents of a column, you can select a column of interest such as the ‘msgclassifier’ by clicking on the column name to highlight/select its contents. If column plot analytics are available across that column, the pie chart icon will become illuminated with color in the upper right corner above the search results panel.
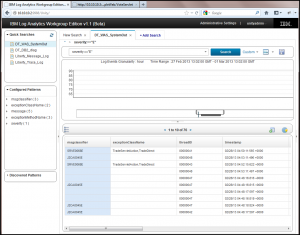
Click on this icon and a pie chart will appear and be pinned to a panel along the right hand side of the SCAA web console. This chart shows the distribution percentage of all of the different message ID’s found for the returned search results.
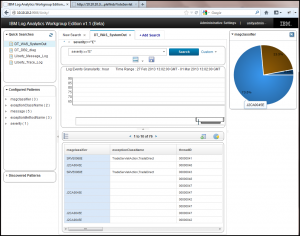
You can pin as many of these as you’d like to help you evaluate the returned search results and decide where to focus further problem isolation and problem determination actions.
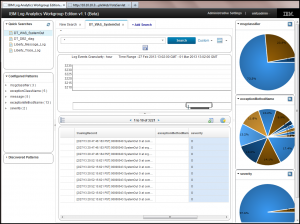
Have Fun and Provide Feedback!!
Have fun playing around with this demo scenario. I look forward to hearing how it works for you and the feedback you have!
Don’t forget about these Vagrant commands!
vagrant up – spin up the box and provision as specified in the Vagrantfile
vagrant up –no-provision – spin up the box but don’t execute any provisioners
vagrant suspend – suspend the box as is, allows for quick start up again (consumes more host resources)
vagrant halt – gracefully shut down the box
vagrant destroy -f – wipes out the box – no part of the base box image will remain
vagrant destroy -f && vagrant up – my favorite – kill all and start fresh!
