≡ Menu

dougmcclure.net

thoughts on business, service and technology operations and management in the digital transformation era

In the prior blog post, I walked through how following the PagerDuty – Nagios XI integration guides leads us to the creation of a “Monitoring Service”. At the end of that post, I mentioned I’d talk about some of the reasons why running in this default configuration isn’t best practice and how this impacts an ops team’s response when using PagerDuty.  I’ll talk about this today as well as layout the next few blog posts about moving to better practices when integrating Nagios with PagerDuty.

These few items called out here are by no means an exhaustive or complete list but do represent many of the significant areas I see in both small and large PagerDuty customer environments and spend the most time optimizing for them.

Your PagerDuty Foundation Isn’t Ready for Event Intelligence, Visibility, Analytics and Modern Incident Response!

“Weak Foundation?”

When the sum of all the PagerDuty parts converge in a best practice configuration, PagerDuty’s platform capabilities ensure people (responder, team lead, manager, exec, etc) receive notifications with the right context at the right time so the appropriate response can be taken.

If the context conveyed via a PagerDuty service and incoming events is super generalized or named after a monitoring tool like “Nagios Service”, the ability to respond with the right urgency, understanding (context) and then take the appropriate action can be significantly impacted.

  • For example, if an on-call responder is paged at 3 AM for a problem with the “Nagios Service”, what’s the appropriate response? Does the “SERVICE_DESC” in your Nagios Alerts prompt the desired response?
  • If the MTTA/R is increasing for the “Nagios Service”, what is the root cause? Is it due to a single server or systemic problem across all the things, certain teams?
  • There can only be one Escalation Policy (EP) for that “Monitoring Service”. This means all events from Nagios into your “Nagios Service” go to the same responder(s) or schedule(s)! If you own it all, great, but chances are you’ve got many responsible groups to deal with.
  • There can only be one automated Response Play for that “Monitoring Service”. Mature operations teams seek to automate operational response where seconds count using automated responses with very specific Response Plays for applications, functional technology types, specific teams or responders.  This isn’t possible due to the limitations of a single automated Response Play for your “Monitoring Service”. Don’t hit the big red panic button for 60% disk full events! (* Multiple Response Plays can be configured and launched manually via the Incident UI or Mobile App.)
  • Responder Notification (Urgency) is broadly applied (High Urgency by default – aka “Wake You Up at 3 AM Setting”) to everything that may be coming in rather than specifically applied based on the required response. Maybe you want to use PagerDuty’s Dynamic Notifications on that “Monitoring Service” but do you ‘trust’ that incoming events have a severity that accurately maps to the needed urgency of an on-call responder’s response? I’ll bet that you’re probably sending in everything as ‘CRITICAL’ anyway. If 1 of 20 servers in your web tier has a ‘CRITICAL’ disk failure – does that warrant a high urgency page at 3 AM?

Sometimes Things [ Are | Are NOT ] Better Together!

mmmm bacon…

One of our better practices is to use Alert Grouping as a means of controlling the noise from poorly configured thresholds or alerting logic, or just plain old “SHTF” situations and alert storms that happen in any ops environment.  Without the use of something like PagerDuty’s Time-Based Alert Grouping (TBAG), every single incoming event results in a unique incident, which sends notifications to the on-call responder(s), rinse and repeat for every…single…event.

The situation that many customers fear when talking about “smart stuff” that is supposed to do whiz-bang grouping, correlating or other AI-ML-EIEIO magic is that the wrong alerts are grouped and things get missed.

PagerDuty TBAG is a hard, time-based approach to group things so if a Network Link 5% Packet Loss event (BFD!) happens in the same time window as a MySQL Process Failure event (Oh, shit!), those things likely don’t relate yet they are grouped together. The first event’s description becomes the incident’s description and someone is paged for the Network Link 5% Packet Loss item and the on-call responder dismissed that incident b/c their quick scan of the incident in the mobile app doesn’t prompt closer investigation or an urgent response. All the while, the critical business impacting MySQL Process Failure alert is unnoticed as it’s grouped in with the Network Link 5% Packet Loss incident. See why the concern? Not a fun discussion with the boss…

PagerDuty’s Intelligent Alert Grouping (IAG) ‘learns’ based upon historical TBAG grouping and responders manually merging alerts into incidents. If IAG makes sense in your future (and it will unless responders are dedicated to doing this manual correlation and merging, it can be challenging to do this within the PD Alert UI), you won’t want to influence what IAG may do with bogus groups that could happen with broad based “Monitoring Services”.

Net net here is you probably don’t want to use alert grouping on big, broad based “Monitoring Services” for fear that things are grouped incorrectly and something uber important is missed.

The Journey along the “Signal to Insight to Action” Path Leads to a Peaceful On-Call Experience!

You can get there…

All PagerDuty customers are entitled to use Global Event Routing and certain Global Event Rules to process and route incoming events to the appropriate service. If you’re following the default Nagios – PagerDuty integration guide and directly integrating with the service, you’re bypassing this very powerful feature.

Building upon this basic Global Event Routing capability is the broader Event Intelligence offering and its own associated Global Event Rules providing a growing toolbox of capabilities to deal with the operational realities of your environment.

When deployed properly you’ll efficiently move from signal to insight to action by ensuring the right events land on the right services at the right time so the right responder/team have the right context to take the right action. Whew, that’s a mouthful – but that’s the real goal here right? If you could avoid waking up Fred, Sally and Shika at 3 AM with non-actionable, low urgency events, WHY WOULDN’T YOU WANT TO DO THAT?

Any of this sound familiar?

  • Alert fatigue from too much noise in your monitoring tools? No problem, there’s a rule for dealing with that!
  • False positive alerts waking people up at 3 AM due to reoccurring maintenance windows? No problem, there’s a rule for dealing with that!
  • Crappy alert metadata leading to missed issues or long MTTA/R because on-call responders don’t grok what the alert is trying to tell them or don’t know what to do next? No problem, there’s a rule for dealing with that!

Don’t Let “Business As Usual” or “We’ve Always Done it This Way” Hold You Back!

Insanity?

Imagine a situation where Nagios is deployed and monitoring ALL of your infrastructure – dozens, hundreds maybe thousands of nodes, services, interfaces, URLs, etc. This would take considerable time and effort to move away from! (Worse, you probably have at least a dozen tools all set up similarly with PagerDuty!)

Imagine the sheer amount of manual work to move from your “Business as Usual” configuration of Nagios and PagerDuty “Monitoring Services” to something better – maybe you’re nervously thinking how you might unpack your “Nagios Service” – it may go something like this:

  • Discover and map out exactly what’s being monitored by Nagios – “I think Nagios Ned can help me with that…”
  • Discover server, application, ‘thing’ owners – “ugh, I have to talk with that group/person…”
  • Discover context of what that ‘thing’ does, what it supports, what is impacted when problems found – “uh oh, I’m feeling really uncomfortable…”
  • Discover what the appropriate operational response needs to be for all event classes/types and who’s responsible – “more meetings…fml…”
  • Translate all of the above to appropriate PagerDuty configurations following best practices – “a whole lot of point+click coming my way…”

There is a much better way and I have some ‘magic pixie dust’ that can help you optimize this!

Where do we go from here?

The next few posts I’ve got in mind build out something like this:

  • Growing up from the Nagios – PagerDuty defaults – Crawling away from the default “Monitoring Service”
  • Introducing the Global Event Routing API – Walking in with your eyes wide open
  • Extending Nagios with Custom Attributes – Running with PagerDuty like a champ
  • Applying Event Intelligence to improve your Nagios + PagerDuty experience for on-call responders
  • Magic Pixie Dust – How PagerDuty can help you ADAPT to a better way of doing things in ops and on-call when using Nagios
0 comments

Nagios (Core/XI) is one of the top 5 most widely integrated tools across PagerDuty’s 10K+ customers providing fundamental host and service monitoring and alerting capabilities. During my time here at PagerDuty, I’ve had the opportunity to work with very very large and well established enterprises and the latest up and coming start-ups / DevOps teams all still relying on good old Nagios monitoring for their infrastructure. I remember the SysAdmin teams I worked with back in the 2000’s using early versions of Nagios, it’s certainly been around for a long time and works well for the basics.

From what I’ve seen, many of PagerDuty’s customers take a “set it and forget it” approach in their integrations. They’ve followed the super simple integration guide (e.g. Nagios XI) and created a “monitoring service” in PagerDuty. In this configuration, Nagios host or service templates are updated to send all Nagios alerts to one single PagerDuty service integration key (the “PagerDuty Contact” pager number) and ALL alerts are sent to PagerDuty notifying on-call responders of the latest Nagios alert. The key here with this default configuration is that everything monitored in Nagios whether it is a Windows or Linux server, network device, database or web server, all of the alert notifications are sent to the same “PagerDuty Contact” (the PagerDuty service) and notify whoever is on that single service’s escalation policy. Most integration guides include an FAQ section at the bottom of the guide with pointers on extending the default integration to address this, but few seem to go down this path. This default configuration pattern isn’t the best practice for an ideal operational response and use of PagerDuty.

When I say “set it and forget it”, what I’m really saying is that the integration well-established up so quickly and ‘just works’, that teams just move on to the next thing vying for their attention in their environment and accept what they have as ‘good enough’.  Some teams have more maturity within their team/processes or have dedicated FTEs solely responsible for the care and feeding of their Nagios configurations as part of their configuration management, CI/CD or similar release process.  Over time, the daily demands of the business and ops prohibit going back and optimizing the Nagios to PagerDuty integration to properly address many of the shortcomings in the default integration guide available today.

What I’d like to drill in on here are a few of these default configurations and their resulting alert, incident and reporting artifacts within PagerDuty and the operational implications over the next few blog posts how to move beyond the defaults to a best practice configuration in both Nagios and PagerDuty.

The Guts of the Nagios XI – PagerDuty Default Integration

The core of the PagerDuty – Nagios XI integration comes down to two parts, the Nagios XI Contact configuration and the Nagios XI Command (and associated pd-nagios python script). Essentially, the contact defines the alert notification conditions and whom (or what) to send the notification details to and the command receives the alert notification metadata (via Nagios macros) and passes this data into the pd-nagios script resulting in a post to the PagerDuty Event API v1.

In the service notification example below, when a service alert is triggered on a host, the configured contact alert conditions are evaluated the service notification command is executed. The default ‘notify-service-by-pagerduty’ command is called passing in a number of parameters to the pd-nagios python script.

Command Line: /usr/share/pdagent-integrations/bin/pd-nagios -n service -k $CONTACTPAGER$ -t “$NOTIFICATIONTYPE$” -f SERVICEDESC=”$SERVICEDESC$” -f SERVICESTATE=”$SERVICESTATE$” -f HOSTNAME=”$HOSTNAME$” -f SERVICEOUTPUT=”$SERVICEOUTPUT$”

This simple Nagios command and associated executable script and parameters is where everything comes together. Let’s review this in more detail.

-n [service|host]: notification_type: This parameter is used to signify if this is a service or host notification from Nagios. It’s used in the pdnagios script to set up which macro values are mapped into PagerDuty event payload fields. This value is displayed in the alert key field.

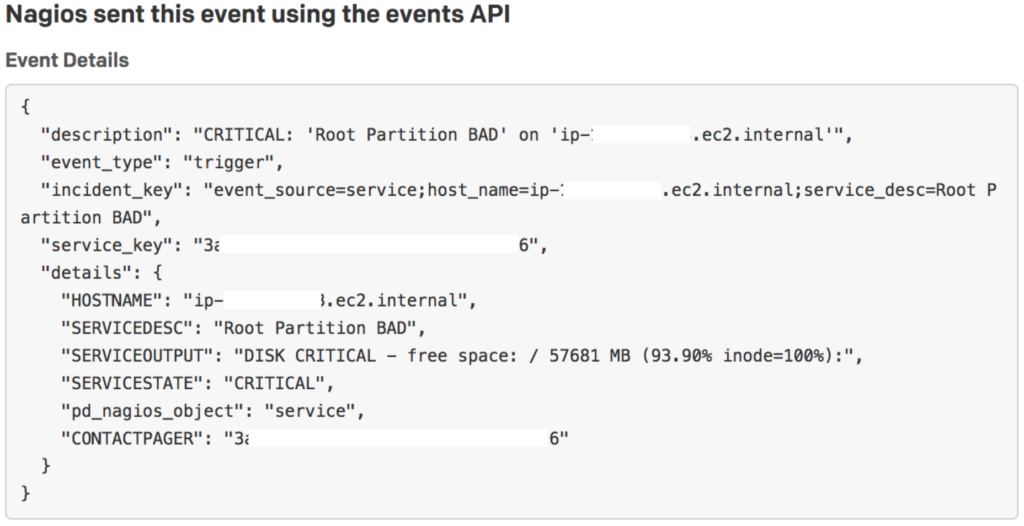
-k $CONTACTPAGER$: This is the pager number/address for the Nagios contact. This value is taken from the pager directive in the contact definition.  This macro value maps into the PagerDuty Event API v1 service_key field and represents the “Integration Key” for the Nagios XI integration configured on the PagerDuty service. This could also be an integration key for a Custom Event Transformer (CET) or the Global Event Routing API key. Set in step #12 of the PagerDuty – Nagios XI integration guide.

-t $NOTIFICATIONTYPE$: A string identifying the type of notification that is being sent (“PROBLEM”, “RECOVERY”, “ACKNOWLEDGEMENT”, “FLAPPINGSTART”, “FLAPPINGSTOP”, “FLAPPINGDISABLED”, “DOWNTIMESTART”, “DOWNTIMEEND”, or “DOWNTIMECANCELLED”). This macro value maps into the PagerDuty Event API v1 event_type field. Nagios XI “PROBLEM” maps to event_type ‘trigger’, “ACKNOWLEDGEMENT” maps to event_type ‘acknowledge’ and “RECOVERY” maps to event_type ‘resolve’.

-f $SERVICEDESC$: The long name/description of the service (i.e. “Main Website”). This value is taken from the service_description directive of the service definition. This macro value is used in the PagerDuty incident description, alert key, service and custom details fields.

-f $SERVICESTATE$: A string indicating the current state of the service (“OK”, “WARNING”, “UNKNOWN”, or “CRITICAL”). This macro value maps into the PagerDuty Event API v1 severity field and is used in the PagerDuty incident description, severity, state and custom details fields.

-f $HOSTNAME$: Short name for the host (i.e. “biglinuxbox“). This value is taken from the host_name directive in the host definition. This macro value is used in the PagerDuty incident description, alert key, source, host and custom details fields.

-f $SERVICEOUTPUT$: The first line of text output from the last service check (i.e. “Ping OK”). This macro value is used in the PagerDuty incident service output and custom details fields.

The results of the Nagios XI – PagerDuty Default Integration

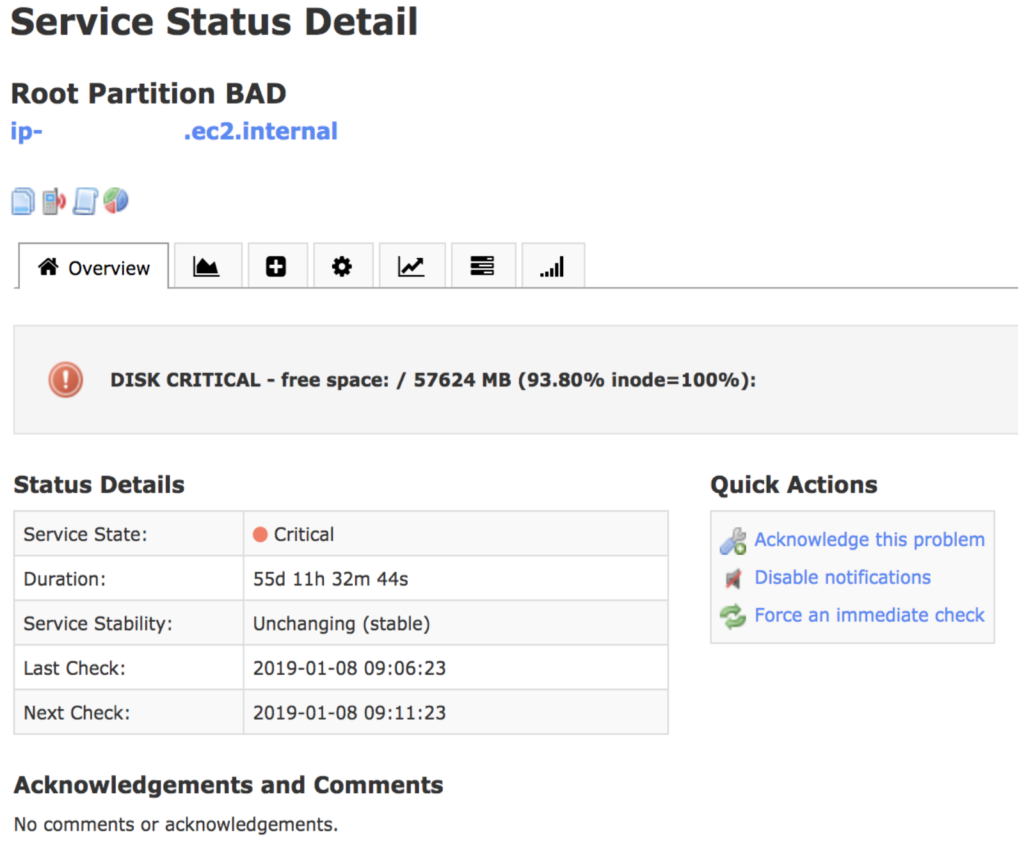
Let’s explore how this default Nagios XI – PagerDuty integration looks as seen in various places the alert and incident could be displayed. We’ll use this Nagios XI alert as the example.

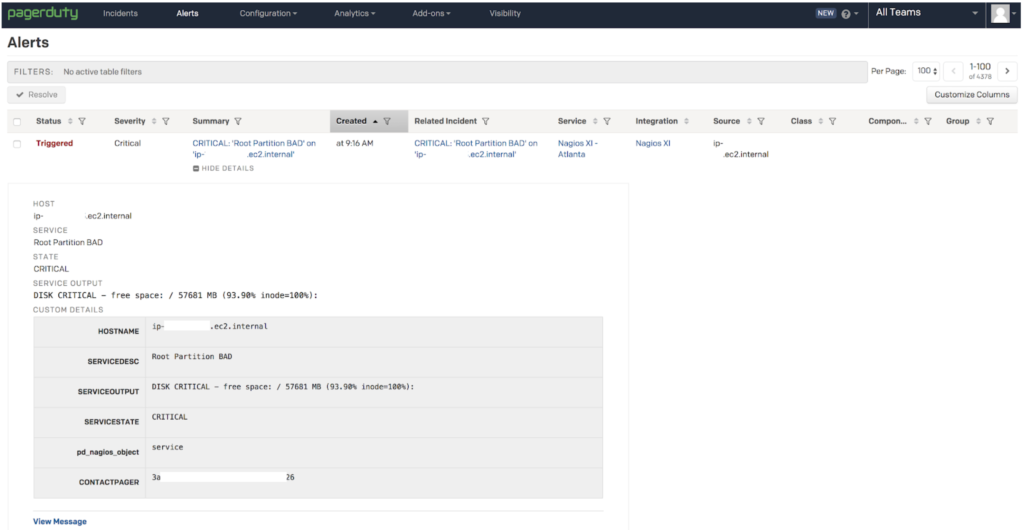
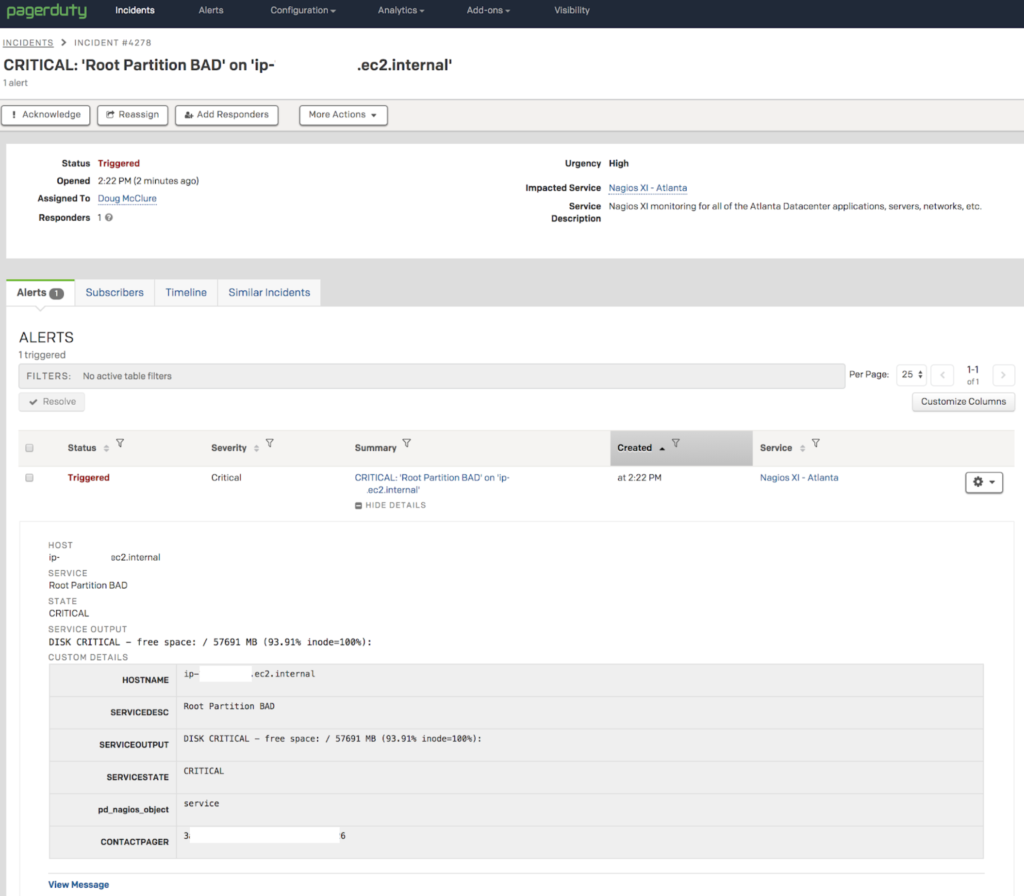
This Nagios XI disk alert will trigger the ‘notify-service-by-pagerduty’ command and pass the macro values to the PagerDuty Event API v1 resulting in a new PagerDuty alert.

This is the resulting PagerDuty alert display within the Alert tab. Note that I customized the column display to show the additional columns that could display alert information.

If “View Message” is clicked on in the lower left corner, a portion of the PagerDuty Event API v1 payload can be seen.

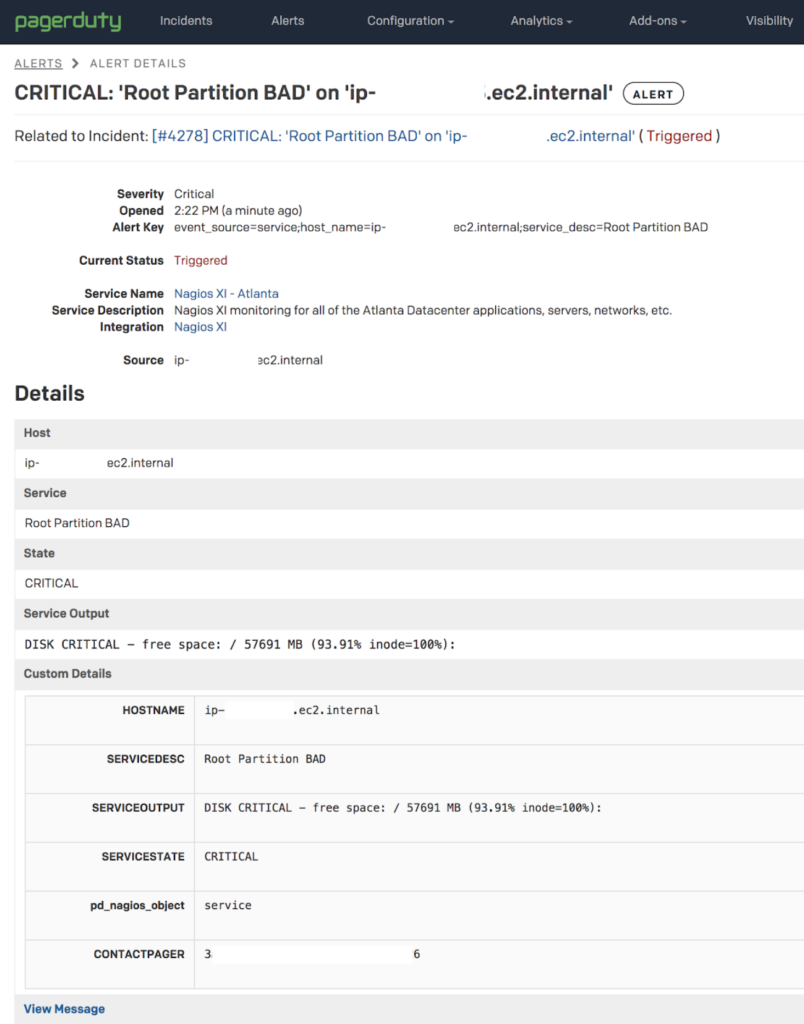
By clicking on the alert summary I can open the alert’s detailed display.

By clicking on the link next to “Related to Incident:”, the PagerDuty incident details is displayed.

If the PagerDuty user has configured their notification preferences to receive email, this is what they would be sent.

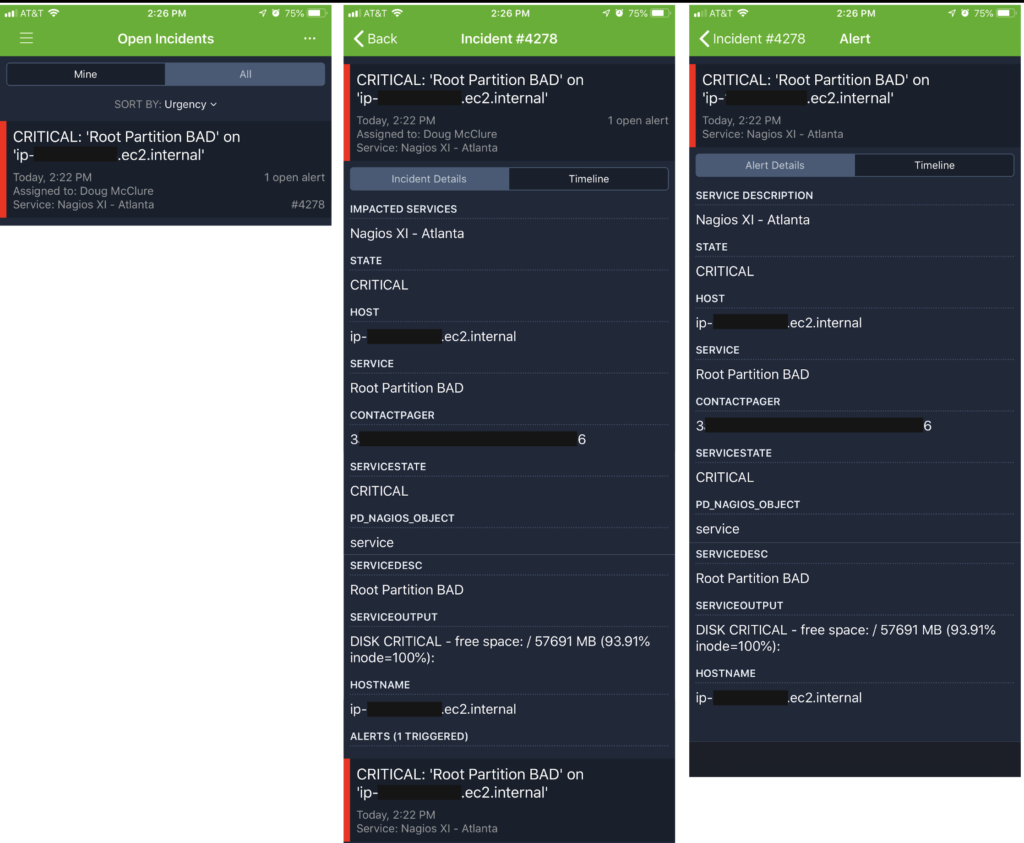
If the PagerDuty user has configured their notification preferences to receive push notifications on the PagerDuty mobile app, this is what they’d see for the incident and alert detail.

In the next blog post, I’ll call out some of the reasons why running in this default configuration isn’t best practice and how this impacts an ops team’s response when using PagerDuty. I’ll also lay out the next steps that can be taken to move towards better practices when integrating Nagios with PagerDuty.

0 comments

Follow one of PagerDuty’s integration guides for common monitoring tools and you’ll quite easily end up with your very own “Monitoring Service” and open the floodgates for incoming signals, alerts or events from that tool now triggering PagerDuty alerts and incidents. In the end, hopefully, you’ll be paging the right on-call person at the right time! PagerDuty makes it super easy to get started with this design pattern no matter the tool in your environment thanks to over 300+ integrations in our portfolio today.  

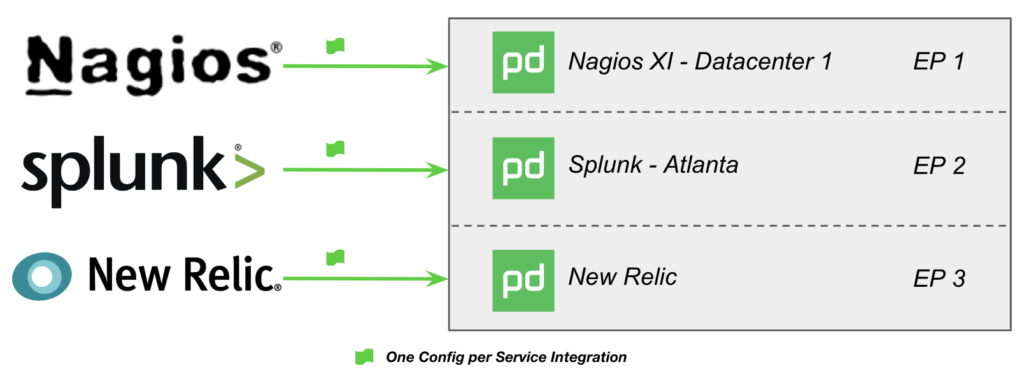
Your “Monitoring Services” may resemble something like “Nagios XI -Datacenter 1” or “Splunk – Atlanta” or just plain old “New Relic”. I see them in all shapes and sizes across customers in all parts of the world and every industry and size. Internally here at PagerDuty, in addition to calling these “Monitoring Services” we also often refer to them as “Catch All Services”, “Event Sink Services”, or “Datacenter Services” because they do one thing well – catch all incoming signals, alerts or events in one single PagerDuty service and notify someone based upon the single escalation policy associated with that service. Works, but maybe not so well in the long run.

The speed and ease at which you can integrate tools into PagerDuty is awesome.  In a very short time, you’re up and running getting value from PagerDuty.  Any responder or any schedule on the escalation policy associated with these kinds of services will get paged. Application Developer team paged for network events, you bet! Security team paged for server foo.bar.com disk space events, you got it! On-call responders paged at 3 am for a problem with “New Relic”, a piece of cake. Trying to engage the right team for the right alert/incident is very challenging when you only have one escalation policy to use for anything/everything that might be monitored by your integrated tool.

If you’d like to apply PagerDuty’s best practices for reducing the sheer number of incidents and notifications in this configuration you can simply turn on Time Based Alert Grouping at let’s say a two-minute grouping window.  Group away!  Sometime later, the Application Support team reaches out to you confused because there are some weird Cisco Chassis Card Inserted alerts grouped together with their important application incidents. The Storage Ops team pings you in Slack confused by the custom “Front Door Visitor” alert grouped into their DX8000 SAN incident. Time is time and Time Based Alert Grouping is just doing its job perfectly across the mega “Monitoring Service”.

Ease and speed aside, as you can see above with not so subtle examples that there are a number of drawbacks from following the “Monitoring Service” design pattern and this configuration certainly isn’t a ‘best practice’.  Over the next few blog posts, I’d like to take you along on a better practice journey by exploring PagerDuty’s service design best practices and our Event Intelligence product through practical applications when using Nagios XI.

0 comments